Using Metrics in Forecasting
Overview
A fundamental component of financial forecasting in startups is projecting the vendor costs linked to product activity. These costs typically, although not always, will be above the gross profit line in COGS.
Finance will get the vendor billing details, and those will include transaction or activity volumes with associated subtotal costs based on an agreed rate card from the original vendor contract.
Simple forecasting techniques could just project total vendor cost increasing at some percentage rate month-on-month comparable to revenue or new users. However, much greater accuracy can be achieved if analysis identifies the key cost contributors for a given vendor and forecasts future costs based on assumed relationships between those contributors and other product activity data.
Identifying Suitable Metrics
It’s not often the case that finance teams can get clear descriptions of how product operation or user activity relate to individual vendor costs. It can be difficult or impossible to get Engineering teams to explain linkages between main metrics such as ‘New Users/month’ and how they relate to the transaction entries on a specific vendor bills. Teams may either be unable to prioritize the analysis or just don’t have a clear understanding themselves of the underlying dynamic.
Hence, finance teams need to plug the gap and figure a suitable basis for forecasting given the information available to hand.
Vendor bills can often list a myriad of individual costs, so if the rate card is complex then it is reasonable to select target costs for analysis based on the proportion of overall cost contributed.
How many to select would depend on the circumstances and a justifiable approach is to select the top five or so and work through a batch of forecast update iterations. Additional metrics can always be added or swapped in as greater understanding of the activity dynamics for the vendor is achieved.
Using Metric Ratios in Forecasting
The principle of using metrics ratios in forecasting is in linking the activity metrics shown on a vendor bill, which are strongly connected to financial costs, to main operational metrics considered reliable across the company, such as new users per month, or upsells from one subscription category to another.
Actual ratio data can then be calculated for historical periods, use that data to form a judgement on forecast assumption and then produce the forecast.
Consider the example depicted below. We have the New Users per Month operational metric and then an ‘AUTH’ transaction volume obtained from vendor bills. An assumption on the rate card cost per transaction is included as well. The green figures are historical and validated data. A simple proportional ratio is calculated using AUTH Transactions and New Users Per Month on a per period basis for historical data:
\[ AUTH:NewUsers = \frac{AUTHTransactions}{NewUsersPerMonth}\]
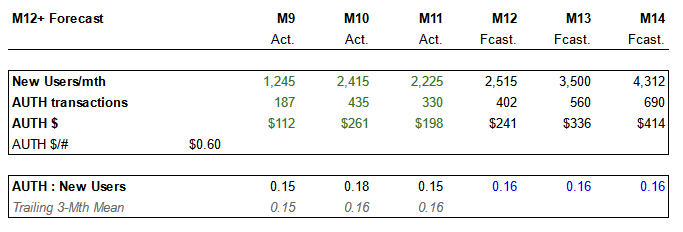
Figure 1: Example metric ratio using AUTH transaction
Note: This assumes a linkage between the operational metrics of new users per month and the AUTH transaction, which may in this example be a specific process to authenticate a users details. It’s reasonable to assume those transactions would occur in the same period as the new user origination. But other transaction types may occur one or more periods after the timestamp of the main operational metric. Good judgement is needed to determine a suitable lag timing.
The AUTH:New Users row contains both the historical calculation and the forecast assumption. In this example a trailing three month mean has been used to inform the assumption choice of 0.16. This assumption then drives the forecast AUTH transaction volume and the resulting cost. In this manner multiple metrics ratios can be calculated and included as assumptions in the forecast build-out.
Update & Reforecast Process
As with any financial forecast a critical part of the management task is the update and reforecast process. Consider the figure below: Actual metrics information is now available for the first month of the original forecast, highlighted in fill colour. A comparison between the actual metric ratio and the original forecast shows a slight difference, and given the similar increase in the trailing three month mean the decision is made to update the ongoing forecast from 0.16 to 0.17.
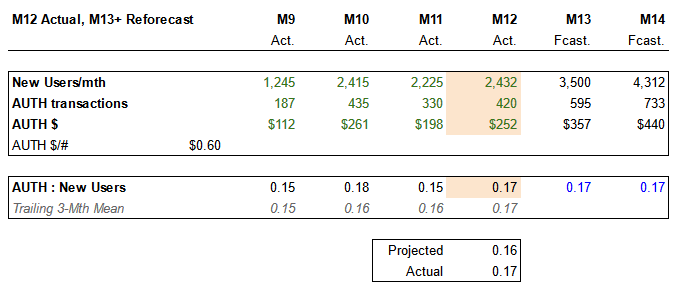
Figure 2: Example update for single time period
The approach here facilitates regular update based upon latest actuals information and optimizing the forecast assumption accordingly. In real scenarios there can of course be much more variability and inconsistency, and forecasts assumptions may not be changed until there is good evidence it’s necessary to do so.
Conclusion
Metrics ratios are a powerful tool in financial modeling. The approach helps to overcome the inevitable deficit of information available to finance teams and enables solid forecasting based on reliable data sources. The review and update process allows for iterative improvements in the forecasting basis as the underlying product transaction dynamics evolve.